Leave a Touch Mark – Focus on the Problem
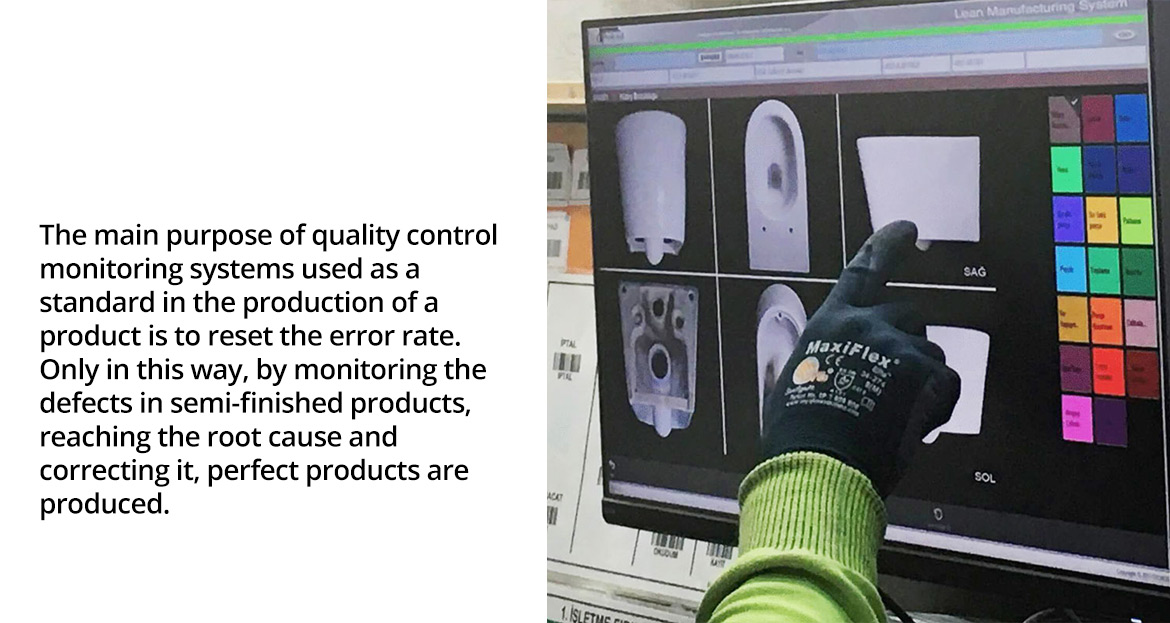
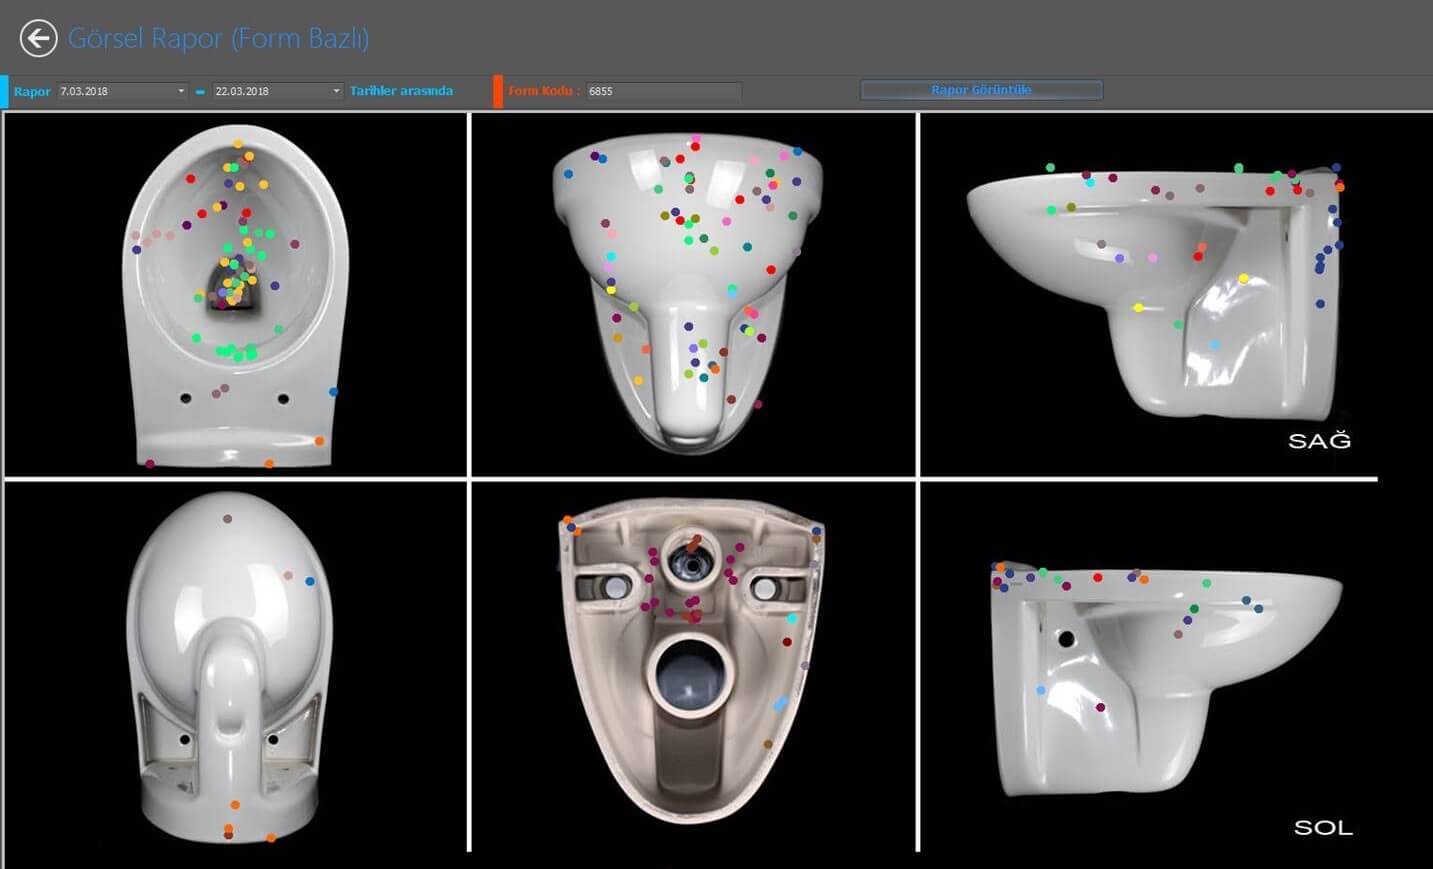
The main purpose of quality control monitoring systems used as a standard in the production of a product is to zero the error rate. However, in this way, the root cause can be detected by monitoring the defects in semi-finished products. Perfect products are produced by reaching and correcting them. If you analyze the Quality Control data statistically, the system will already show you where the problem lies. Defect Concentration Diagram, this It is a simple visual tool that helps to collect and analyze data for this purpose. Data collection by making markings in different colors for the defect types determined on the image of the product to be examined from every angle, and With the visual analysis of the data, it enables to focus on the right place during the problem solving phase.
When is it used?
The Error Density Diagram is effectively used when : Gathering data for the definition of the problem, to show the effect of corrective actions on the product, produced with a large number of errors when researching a product, identifying the location of problems.
How To Make?
+ First the Fault Density Diagram is designed and the areas to be checked are drawn/photographed. The parts or areas to be drawn are prepared.+ It is decided how the errors will be shown in the diagram. If necessary, the diagram is developed according to the feedback.
+ Data is collected with special software via virtual reality tools or touch screens.
+ The samples must be representative of the production process.
+ Even if there is more than one person collecting the data, all data is organized jointly. The location of each error is marked in the Error Density Diagram.
+ The Error Density Diagram is analyzed, focusing on the problems and immediately starting to develop solutions. (The more data accumulates in error density, the more precise judgment can be made.)
